For our 2022 survey, we asked 22 of the biggest media and publishing organizations in Europe (including the UK, the Netherlands, Germany, Belgium, France, and Italy) about their social media usage. We then combined this data with media and publishing industry statistics from other reports, to provide additional insights and validation.
Some results were expected. For instance, Facebook and Twitter are the most popular social media platforms for media and publishing teams. While other statistics were more surprising, such as that most media teams still face challenges when creating visual social media content.
Read on to discover all the statistics and analyses, as well as tips and recommendations based on the data.
What is the primary goal of media brands’ social media channels?
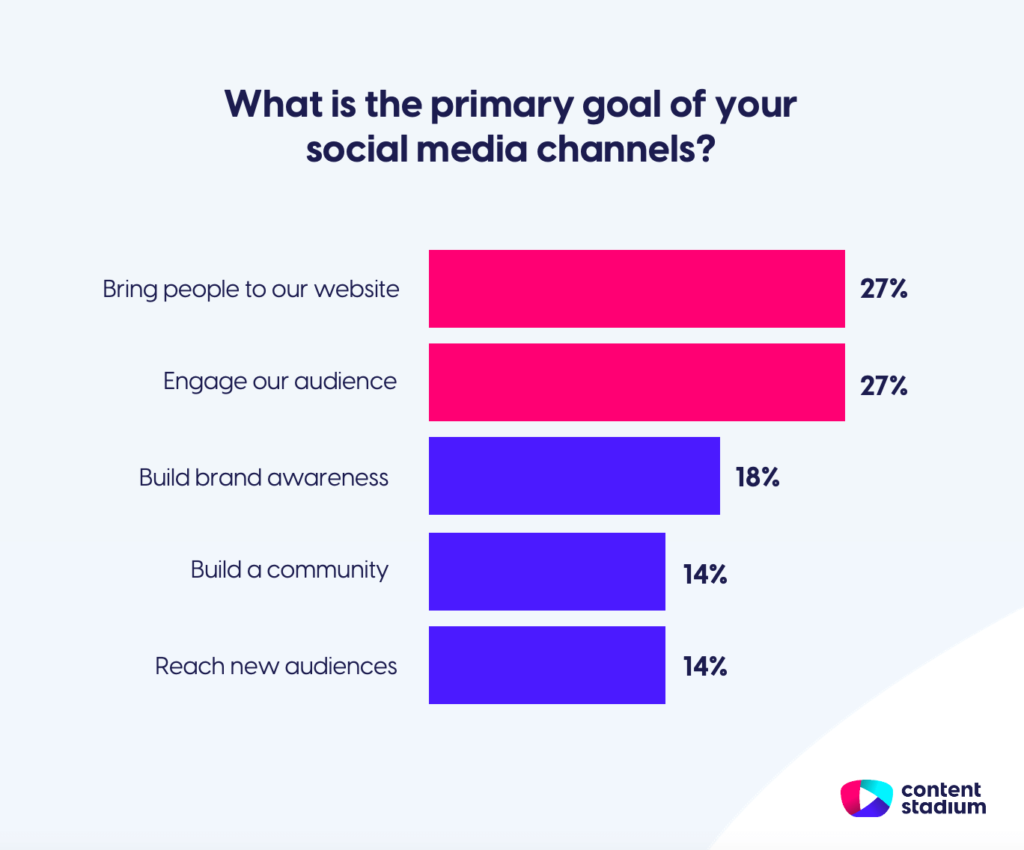
Our research revealed that the social media goals of media and publishing brands vary per organization. However, two primary goals came up more frequently than the others: engaging their audience and bringing traffic to their website.
Meanwhile, reaching new audiences, building brand awareness and building a community were also selected by some organizations. And no organization stated that their primary goal was different from those included in the above list.
Is your social media goal also to increase web traffic? Discover our tips on how to drive traffic from social media to your website.
Which social media channels are media and publishing organizations using?
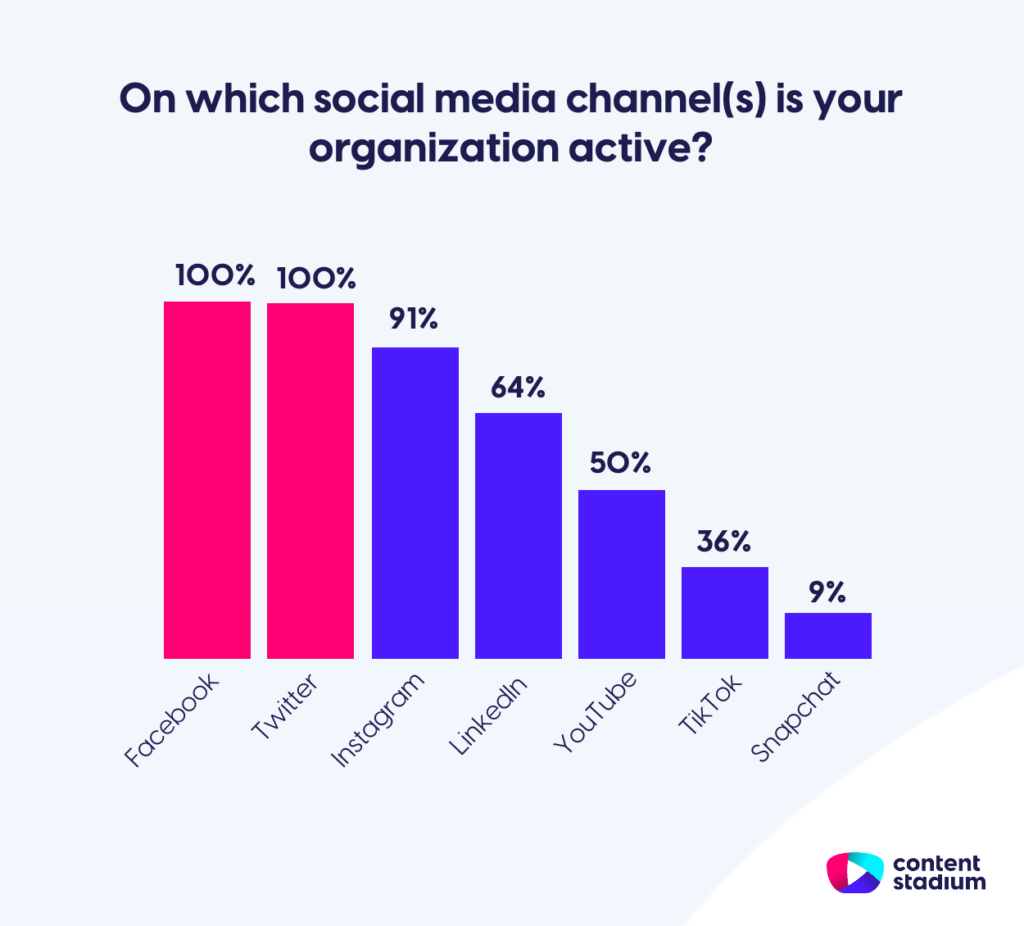
Our survey showed that all participating media and publishing brands use Facebook and Twitter. Instagram came in third position, used by more than 90% of media teams. And more than a third of organizations are already using TikTok.
On the other hand, Snapchat is the least popular social media platform, with less than 10% of the industry using the app. And while the statistics show that not every media and publishing brand is yet on every channel, one respondent stated that “Being everywhere [every social media channel possible] is mandatory to stay in the mind of your audience and to build a brand.”
Seeing that a key goal for media teams is to drive traffic to their website, it’s not surprising that Facebook and Twitter are their most-used channels. Facebook is said to be the best platform for social media referrals, while Twitter is seen as hugely influential for reaching high volumes of traffic.
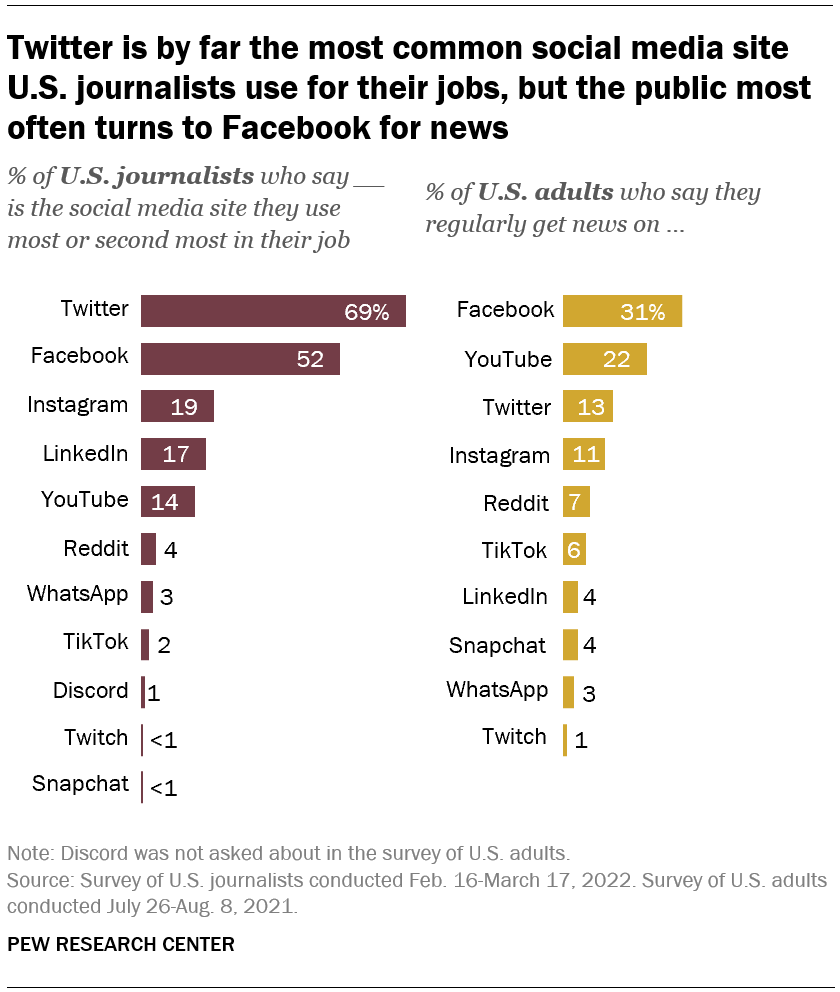
In addition, 2021 research by DataReportal showed that Facebook is the world’s most-used social platform. And 2022 research by the Pew Research Center found that Twitter and Facebook are the go-to social media sites for U.S. journalists, while the public most often turns to Facebook for news.
How frequently are media teams posting on their social media channels?
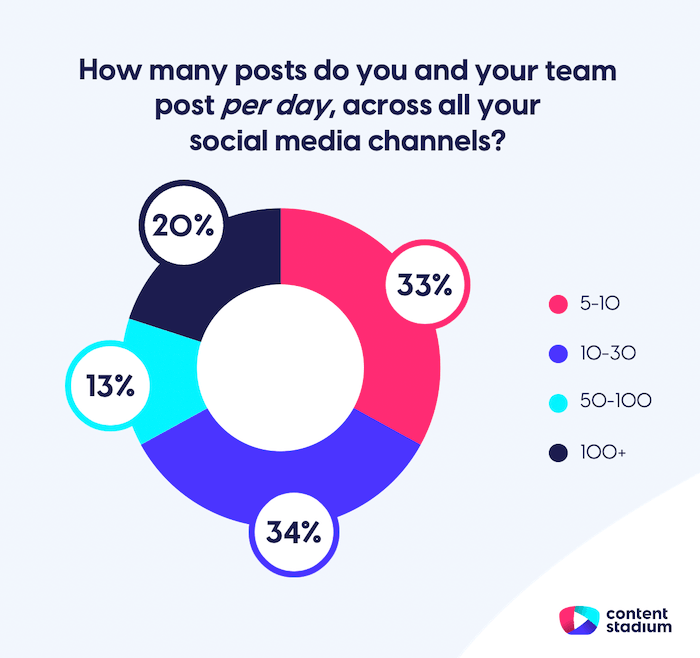
As expected, media and publishing teams post a lot of content on social media. Our survey revealed that the vast majority (67%) post more than 10 posts per day (or 70+ posts per week), with 20% posting more than 100 pieces of content per day (or 700+ posts per week!).
These findings align with Rival IQ’s 2022 report. The report found that media brands post an average of 171 posts per week across Facebook, Twitter and Instagram.
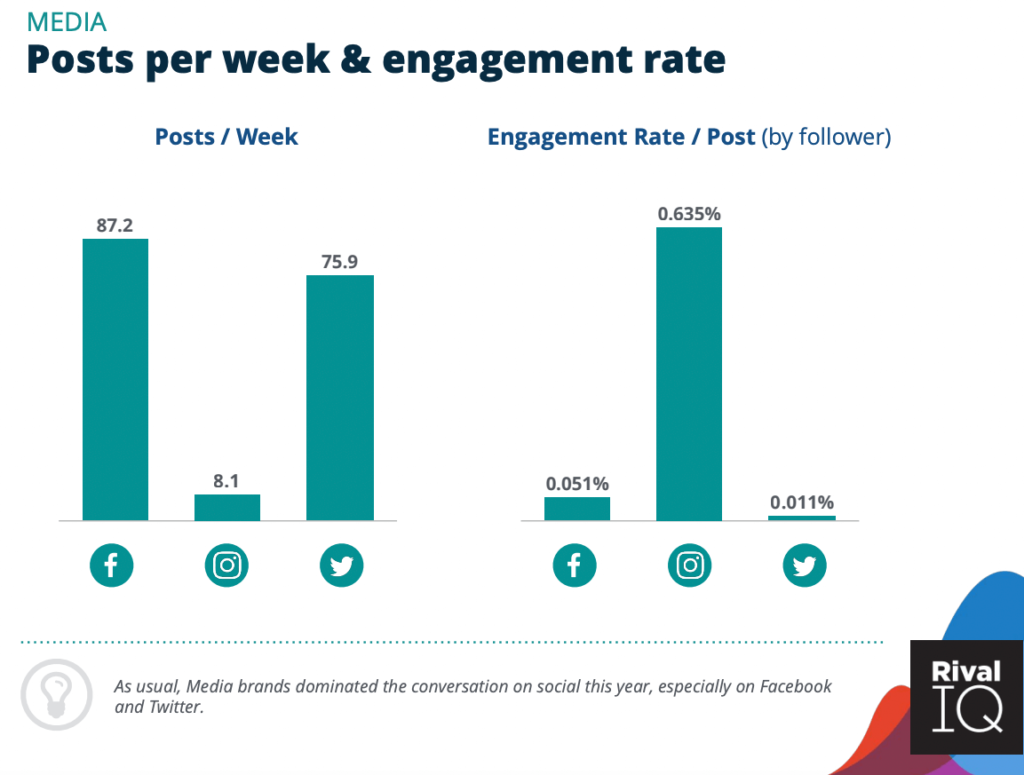
Their statistics also showed that media brands increased their posting frequency in the last year, and that they have the highest posting frequency across Facebook and Twitter compared to all other industries.
What type of content are media and publishing teams posting on social media?
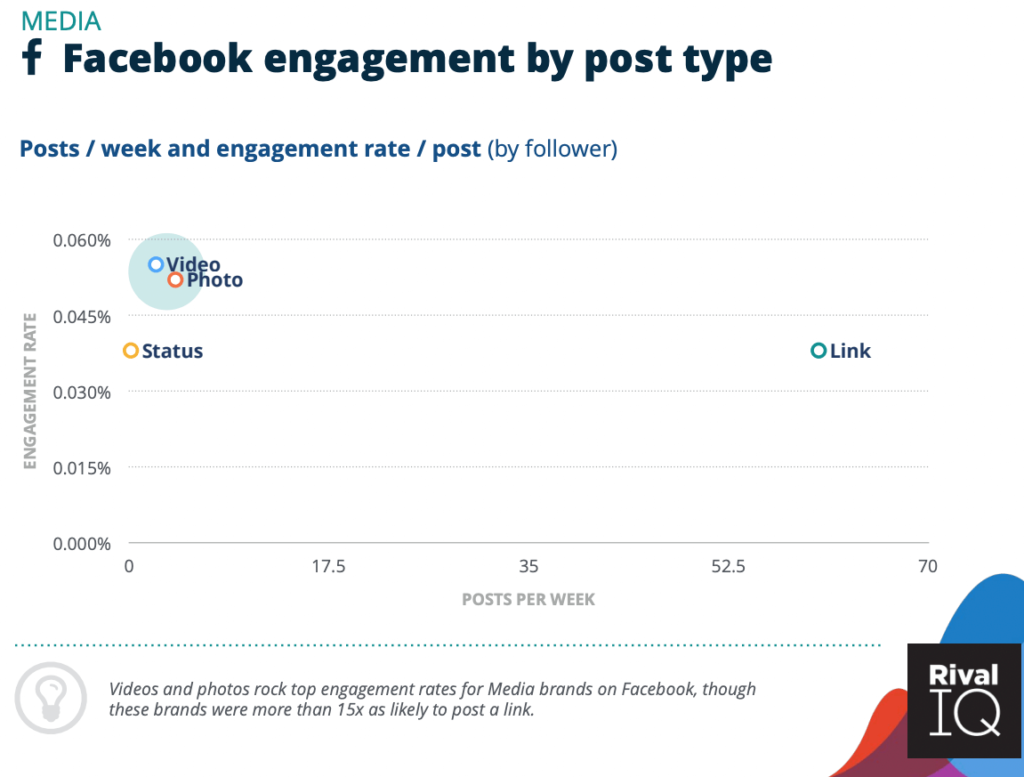
Rival IQ’s report found that links were by far the most common post type on Facebook and Twitter for the media industry. The statistics showed that media brands were 10-15 times more likely to post a link, compared to a video, photo or status.
However, the data revealed that photos and videos outperform link posts in terms of engagement on these channels. So a recommendation for media brands looking to increase their engagement is to focus on video and photo posts instead.
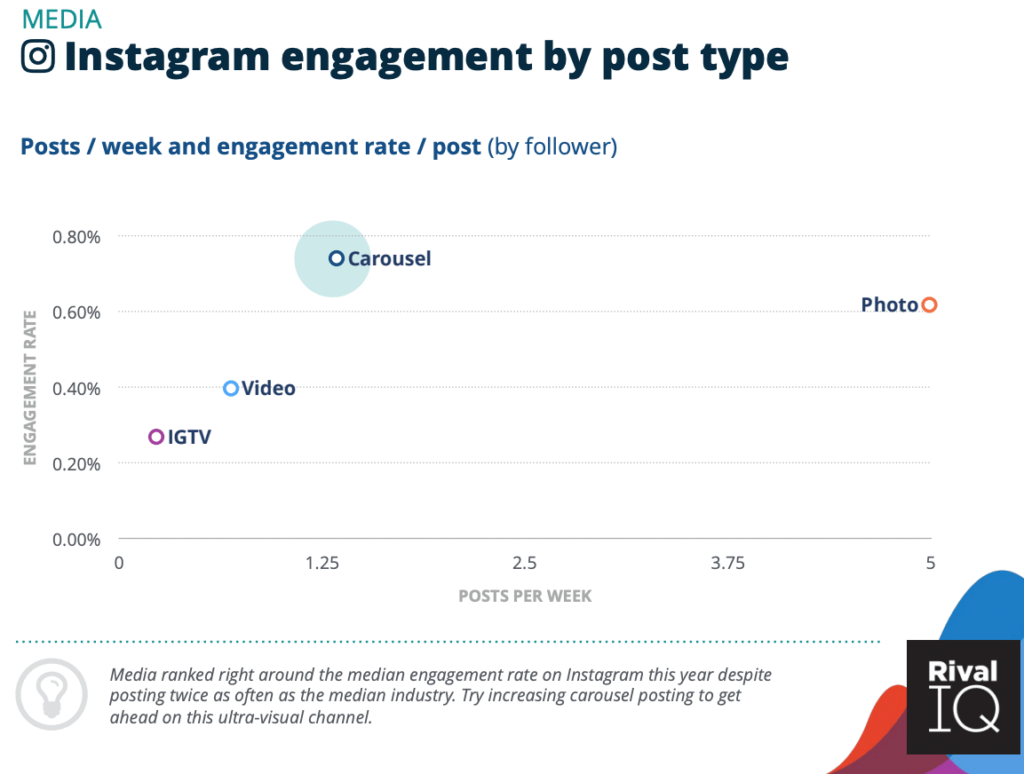
On Instagram, media brands received their highest engagement rate. The statistics showed that carousel posts performed especially well, with the highest engagement rate. So don’t forget to use this function more!
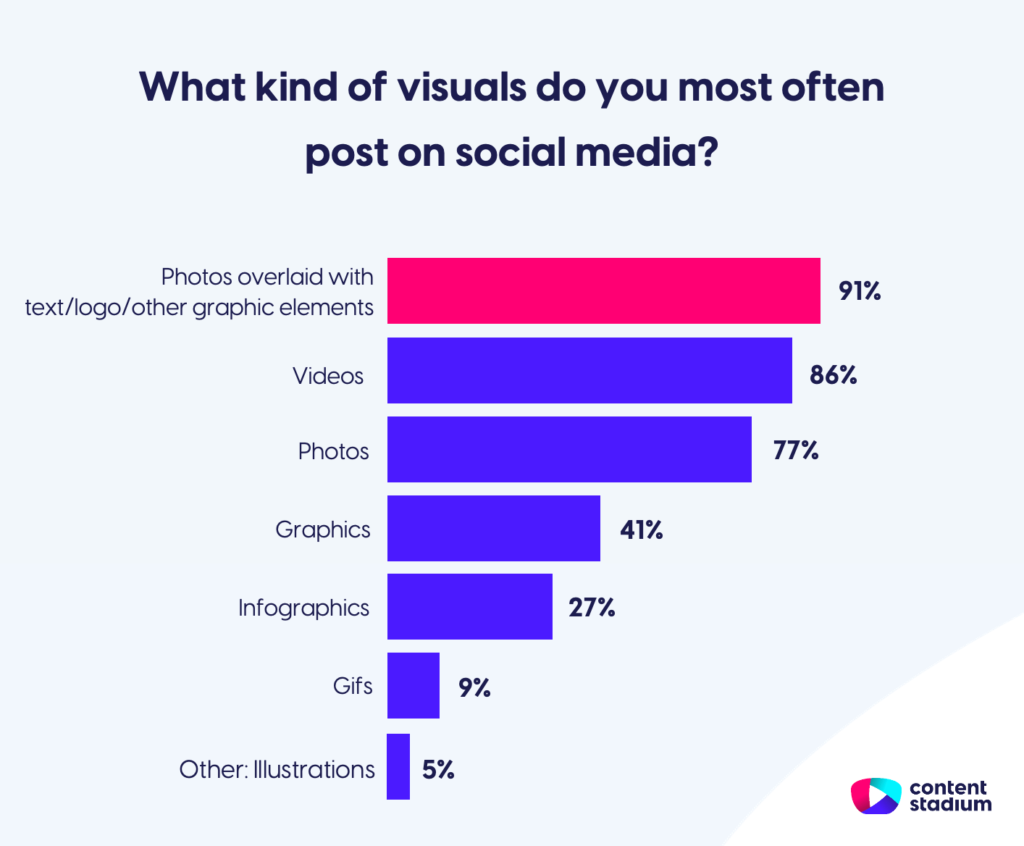
During our research, we dived deeper into the type of photo and video content that media teams most often post on social media. When it came to photos, photos overlaid with text were the most popular choice (91%). Videos came in second place (86%) as the most popular social media visual content.
How do media teams create their social media visuals?
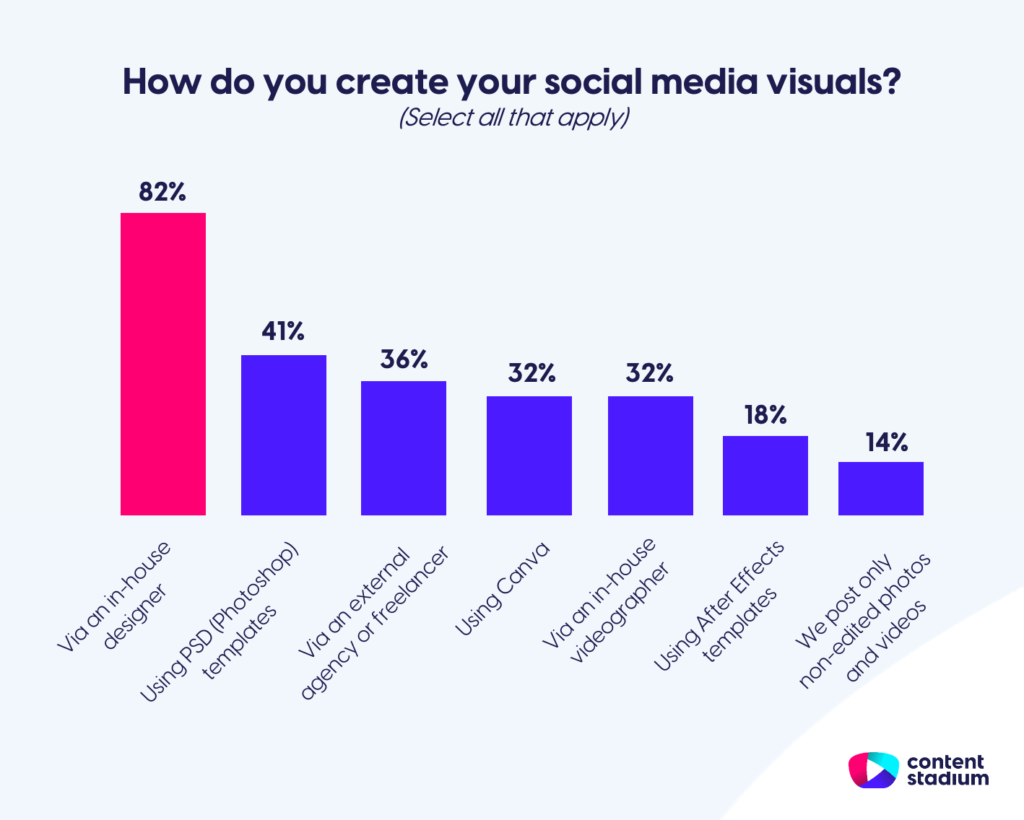
Our data showed that most media and publishing teams (82%) use in-house designers to create their social media content. But the majority of teams who get help from in-house design resources also make use of other tools and techniques to complement their content creation process. These included Adobe (Photoshop and After Effects) templates, Canva and external agencies.
Surprisingly, more than 10% of the media teams surveyed are still only posting un-edited (plain) pictures and videos on social media.
What challenges do media brands face when creating content for social media?
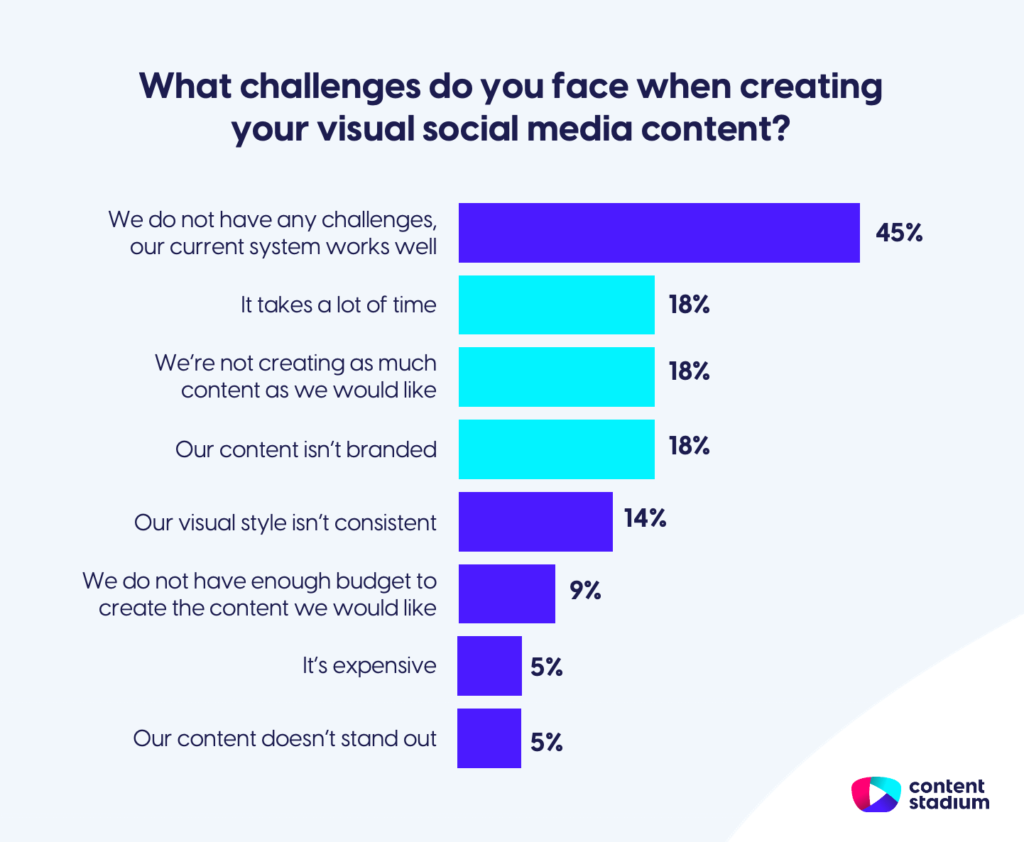
While several media and publishing teams stated that their visual content creation process works well, our survey indicated that 55% of organizations still experience difficulties when creating visuals for social media platforms.
Three main issues emerged from the statistics: it takes a lot of time to create visuals, teams are not creating as much content as they would like, and content isn’t branded.
When asked about their content creation process, one survey respondent added: “Creativity is the key! That includes how to shift angle and strategy within underbudgeting”. This suggests that a lack of resources is a common issue that media teams face.
Looking for ways to create more content, faster, and more consistently?
At Content Stadium, we give media, publishing and newsroom teams the tools to create and share standout graphics and videos themselves, in just a few clicks. Helping you relieve pressure on your design team, while creating more quality content faster.
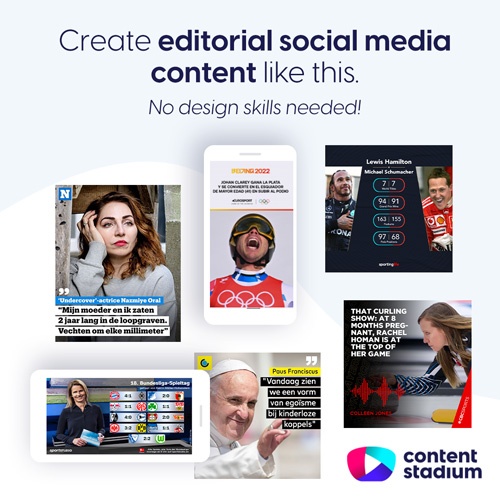
Join Eurosport, CBC Sports, AD, HLN, Het Nieuwsblad, Transfermarkt, and more media teams: discover our content creation platform for media & publishing teams.


It’s a relief that it’s no longer so complicated to create branded social posts.
Ewoud, Digital Publisher at Het Nieuwsblad >
Get more social media tips and ideas
- Get tips on how to increase traffic from social media to your website.
- Be inspired by these Twitter carousel examples.
- Learn how media website Sporting Life uses our templates to step up their branded social media visuals and increase traffic to their website.